Basic Scripting With Awk And Gnuplot
Posted to HN. Comments and discussion highly encouraged.
Introduction
This will be a short example-based guide to (a) awk (b) gnuplot and (c) using them in a script.
I needed to graph some data based on the output of a command run a couple times. So what better way to solve that five minute task than to spend an hour learning awk & gnuplot to automate it?
The Problem
I needed to compare how long a program says it takes with how long it actually takes to execute. So I wanted to run it a couple times and produce a graph of real vs reported times.
To do this, we could use the time command to retrieve its 'real' time. My program
already prints (to stdout) the time it says it takes to complete. The output looks like
"Time = x", where x is some decimal number. I'll describe the time output later.
The final table that I want the script to produce should look something like this
(these are just random numbers):
| Trial | Real Time | Printed Time |
|---|---|---|
| 1 | 12 | 2 |
| 2 | 44 | 5 |
| 3 | 21 | 3.6 |
| … | … | … |
Awk
Awk 101
A good introduction is Awk in 20 minutes, I'd recommend skimming through it.
Awk is a text-processing language that revolves around patterns and actions.
Patterns are like regular expressions (e.g. hello, or hello+ if you want one
or more 'o' characters), actions are just a list of statements (e.g. { print 1; }).
All patterns are checked against every line, and there corresponding action
will be executed if there is a match.
Here's an example of using awk to print 1 if some line of the input contains hello:
echo hello | awk '/hello/ {print 1;}'Note on zsh's time
I use zsh's time which has a slightly different format to bash. Also, both output
to stderr so you'll notice 2>&1 which redirects stderr to stdout.
Building The Table With Awk
We're going to need variables, like an index to a for loop, to print
the 'trial number'. No problem, we can initialize one with the -v
option like so awk -v j=1 [script] (set j to 1).
We can also ask awk to give us the nth word in the current line with
$n, where n is some integer.
And that's basically all we need! Here is the script:
# "Time" will appear before "java" in my output (e.g. "Time ...\n java ...\n Time ...\n ...").
# Also, substr used to remove the 's' character from time's output
awk -v j=1 '/Time/{printf("%d %s ", j++, $3)} /java/{printf("%s\n", substr($5, 1, length($5)-1))}'
I shall elaborate a little more.
My program could be run like time ./java arg1 arg2 2>&1 which would produce 2 lines
of output, the first containing "Time = [integer]", the second containing the output
of time. So my awk script will either see "Time", where it will
print the index and integer, or it will print the real time after seeing "java".
Notice that I don't print a newline with the "Time" action (which will come first
in my output). So I can build a row from data that spans multiple lines (2 lines in
this case.) Also, my output doesn't have any lines that contain both "Time" and "java".
When my program is run five times and the output is piped to that awk command, it produces data like this:
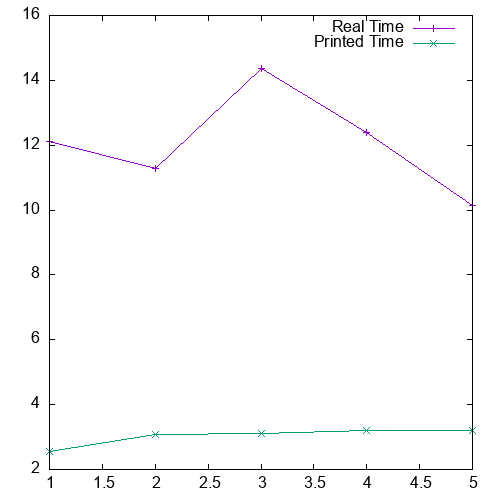
1 12.11 2.547
2 11.294 3.07
3 14.375 3.102
4 12.407 3.208
5 10.147 3.212
Which is what we want for gnuplot.
Gnuplot
To plot our data, we could have two lines. One would use the second column for the y-axis, and the other would use the third. Both use the first column (the trial number) for their x-axis1.
To tell gnuplot to use two columns: using 1:2 or u 1:2 specifies column 1 to be on the x-axis
and column 2 on y. To plot one line, you'd use p "data.dat" u 1:2 title "My Plot" w lp (w lp means
make it a line plot), but we want two lines, and also to use this without gnuplot's interactive mode, so
here's the full command:
# data.dat is my file name, convention seems to end it with *.dat.
SETUP_OUTPUT="set terminal png size 500,500; set output 'blogplot.png';"
PLOT_DATA="p 'data.dat' u 1:2 title 'Real Time' w lp, 'data.dat' u 1:3 title 'Printed Time' w lp"
gnuplot -e "$SETUP_OUTPUT $PLOT_DATA"
Which outputs to a png called blogplot.png when executed:

There isn't really a significance with 'trial number' in this case, so this graph isn't particularly useful. But this isn't a post about stats.